Created: Edited:
A while ago, I revisited nearest neighbor search methods. A few Wikipedia articles later, I decided to write my own implementation of a Voronoi diagram. Specifically I wanted to use Fortune’s algorithm. It wasn’t easy to find a good explanation of this algorithm and “clean” (in terms of readability) implementation was almost nonexistent. Nevertheless, I decided to create one and share it here. The code and demo is available here: demo
What is a Voronoi diagram?
Given a set of points (called sites) in space, Voronoi diagram partitions the space into regions, with each region associated with a site. Each point within a region is closer to the corresponding site than to any other site. This property allows us to very easily answer a query: “What is the closest site for a given point in space?”. A good example of Voronoi Diagram diagram is map of the Earth with airports listed as sites (linik).
Delaunay triangulation
An interesting property of Voronoi diagrams is that their dual graph is the Delaunay triangulation. By connecting the sites corresponding to the edges of the Voronoi diagram, we obtain a convex hull composed of Delaunay triangles.
Fortune’s algorithm overview
Stephen Fortune’s algorithm constructs a Voronoi diagram in \(O(n \log n)\) operations, where \(n\) is the number of sites. It belongs to a class of sweep line algorithms commonly used in computational geometry. As the sweep line moves across the plane, it leaves behind vertices of the Voronoi diagram and maintains a beach line, which is composed of parabolic arcs. Each arc’s focus point is a site provided as input.
If you want to know why this algorithm uses parabola, recall that the set of points equidistant from site and horizontal line is indeed a parabola. When two parabolas intersect, the point of intersection is equidistant from the two sites, meaning it lies on a Voronoi edge. Similarly, points where more than two parabolas intersect correspond to the vertices of the Voronoi diagram.
The sweep line doesn’t move smoothly with a predefined step.Instead, it jumps through points that contribute to the building process. After all events are processed, the Voronoi diagram is complete. A simplified version of the algorithm is often presented as follows:
1
2
3
4
5
6
while(!queueOfEvents.isEmpty()) {
	event = queueOfEvents.pop();
	beachline = event.verticalPos;
	if (event.isSiteEvent) handleSiteEvent(event);
	else hadnleEdgeEvent(event);
}
Implementation details
Beach line
Some Internet sources mention that beach line is internally stored as a binary search tree. This is not entirely true. It is in fact binary tree, however, a special one where each internal node represents an edge and every leaf is an element of beach line (parabola). This construction leads to very important observation.
Namely, successor and predecessor for en edge (internal node) are always leaves nodes (parabolas). On the other hand, successor and predecessor of the parabola are always edges connected to this parabola. Understanding of this data structure is crucial if you want to fully grasp implementation details of the algorithm.
If nodes of the tree can be fundamentally different objects, how to order them and implement searching? When sweep line goes top to bottom (this direction preserves usual parabola equation), we might want the beach line to be ordered left to right. Since we will later ask which parabola is present at certain x-coordinate, we will use crossing points of successor and predecessor as key of our binary tree. This algorithm doesn’t require to define key property for parabola, only for edges.
Handle Site
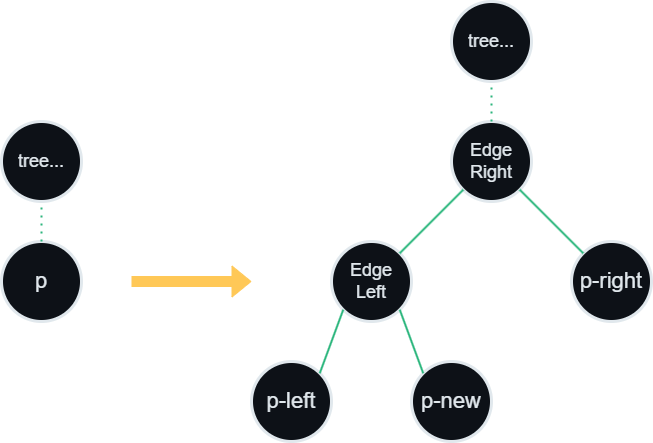
When processing a site event which lies directly on the sweep line we obtain a direct vertical line from equation of parabola. We find the closest leaf p of the tree to the x-coordinate of this site. Since the site itself will produce another parabola we have to split p into left and right side with newly constructed parabola dividing each side. In fact we will remove parabola p and construct two new parabolas, each representing left and right side of p.
From this procedure we see that one parabola is being deleted while three new are being added. This means that at least two new internal nodes have to be created (since parabolas must represent leaves of the tree). Those two internal nodes will represent edges starting from split point of parabola p one directing right side and the other left side. Finally, we have to compute upcoming events for left and right offspring of p. Below a construction scheme of this procedure is presented graphically.
Handle Edge
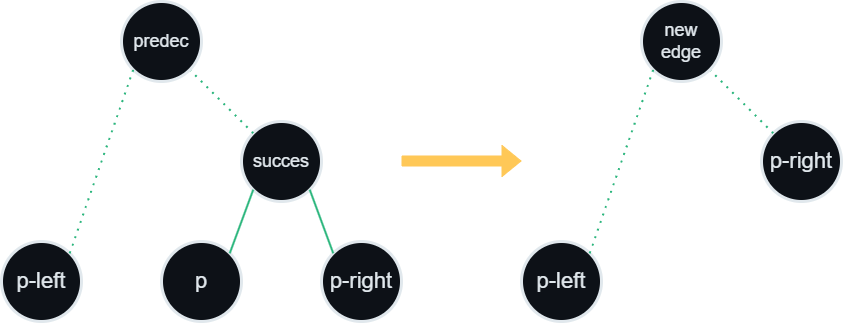
Edge event means that two parabolas pLeft and pRight grew big enough to shrink other parabola p, which wast between them and triggered this event, into nothingness. This means that we found crossing point of at least three parabolas and therefore a vertex of Voronoi diagram. We have to remove p and two edges was connected to it. From our previous observation we know that edges associated with this parabola are successor and predecessor this node. From properties of binary tree we have that at least one edge has to be immediate parent of p.
In this procedure we will remove p with it’s edges and create one edge growing from newly discovered vertex. After localizing older edge (one which isn’t immediate parent of p) we replace it with a new one. Then we simply remove p and its parent from the tree. When nodes are successfully removed, we can compute upcoming events for pLeft and pRight. A graph representation of those operations is presented below.
Checking crossing points
This procedure computes upcoming events for parabola p. We get its closest sibling nodes, which are successor of successor and predecessor of predecessor. If siblings of p describe two different parabolas we compute crossing points of its edges and queue up new event associated with p and occurring at intersection point.
Cleaning up
When queue from main loop of the algorithm ended successfully, we still have to do a little cleanup. Firstly we have to “finish” all edges that are still present in the tree. Those will have end points outside the bounding box of the algorithm. Additionally, we have to join all edges (left and right) created while processing sites. And that’s it.
Final thoughts
By breaking down each component of the algorithm, how events are processed, how the beach line is maintained, and how final cleanup is handled, it becomes clear how elegant and efficient Fortune’s algorithm really is. Although it takes some effort to fully grasp its details, once understood, it opens up a range of possibilities for solving geometric problems.
Feel free to explore the code and demo linked above to see the algorithm in action, and I hope this breakdown helps you with your own implementation.